Australian housing values continued to record a broad-based rise despite the disruption from lockdowns.
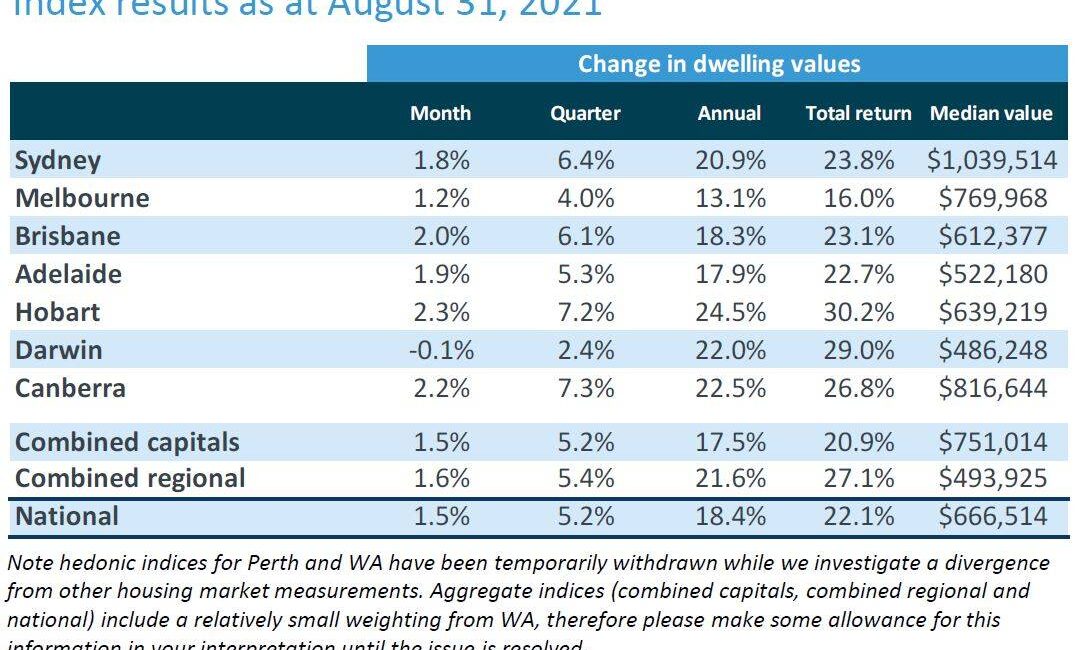
CoreLogic’s national home value index showed dwelling values rose 1.5% in August; a rate of growth that is still well above average, but the lowest monthly rise since January.
The lift in housing values continues to be broad-based, with every capital city, apart from Darwin (-0.1%) recording a rise in values throughout the month, although it is important to note CoreLogic has withheld the Perth and Regional WA index results pending the resolution of divergence from other housing market measurements in WA.
Property price growth is slowing
The August home value index provides further confirmation that the rate of price growth is moderating after moving through a peak in March of this year.
At that time, national home values had risen 2.8% in a month, led by the Sydney property market where dwelling values were up 3.7%.
The slowing rate of growth probably has more to do with worsening affordability constraints than ongoing lockdowns.
Housing prices have risen almost 11 times faster than wages growth over the past year, creating a more significant barrier to entry for those who don’t yet own a home.
Lockdowns are having a clear impact on consumer sentiment, however, to date the restrictions have resulted in falling advertised listings and, to a lesser extent, fewer home sales, with less impact on the price growth momentum.
It’s likely the ongoing shortage of properties available for purchase is central to the upwards pressure on housing values.
The August update takes Australian housing values 15.8% higher over the first eight months of the year and 18.4% above levels a year ago.
In dollar terms, the annual increase in national dwelling values equates to approximately $103,400, or $1,990 per week.
In comparison, Australian wages are rising at the average annual rate of 1.7%.
This is the fastest annual pace of growth in housing values since the year ending July 1989.
Through the late 1980s, the annual pace of national home value appreciation was as high as 31%, so the market isn’t quite in unprecedented territory.
The annual growth rate at the moment is trending higher, in fact, it is 3.6 times higher than the thirty-year average rate of annual growth.
Capital city houses are continuing to record a stronger growth rate relative to units, however, the performance gap does appear to be narrowing.
Throughout the first quarter of the year, capital city house values were rising approximately 1.1 percentage points faster than units each month.
By August the average performance gap reduced to 0.7 percentage points.
The convergence of growth in house values and unit values could be another demonstration of affordability becoming more challenging.
The narrowing gap between house and unit value growth is most noticeable in Australia’s most expensive city, Sydney, where the monthly growth rate for houses was 2 percentage points higher than units in March.
That ‘gap’ has now reduced to 0.6 percentage points in August.
Based on median values, Sydney units cost almost $470,000 less than a house.
At the same time, the growth gap between houses and units in Melbourne and Brisbane has widened.
Both advertised supply and housing demand have been negatively impacted over recent months.
In early May, newly advertised properties were tracking 19.7% above the five-year average, however, due to both lockdowns and seasonal factors, the number of new listings through August dropped to -5.8% below the five-year average and total active listings were -29.4% below average.
The estimated number of home sales has also been impacted, dropping by -9.0% nationally over the three months ending August when compared to the previous three-month period.
Despite the fall in sales, housing market activity remains well above average levels.
Although there has recently been a trend towards fewer buyers, the past three months have seen the number of home sales remain 30% above the five-year average at a time when active listings are -29% below average.
We are still seeing a disconnect between advertised supply and housing demand, even in the cities where lockdown restrictions are active which is keeping upward pressure on housing prices despite challenges faced by both buyers and sellers.
Strong selling conditions can also be seen in auction clearance rates and private treaty measures.
Auction clearance rates have trended lower, especially in Melbourne where a large proportion of auctions have been withdrawn from the market.
However, where properties have proceeded to market, the large majority are recording a successful result, albeit with a large proportion selling prior to the auction rather than under the hammer.
Similarly, the median number of days it takes to sell a property is showing a mild upwards trend, however, most cities, including those navigating extended lockdowns, are continuing to see homes sell in 30-35 days or less.
At the same time, vendor discounting rates remain at record lows implying most vendors aren’t budging much on their initial pricing expectations.
The pace of rental growth has softened over recent months, but the trend in rising rents remains strong.
Nationally, rents have lifted by 8.2% over the 12 months ending August, the largest rise in rents since 2008.
There remains a stark difference between the pace of growth in house rents, where nationally the cost of renting has risen by more than double the pace of unit rents; 9.9% nationally for houses compared with 4.0% for units over the 12 months ending August.
This difference between rising house rents and unit rents is most pronounced in Sydney and Melbourne, where unit markets have recorded a substantially lower growth rate.
However, most of the capital cities are recording the same pattern, but in a less pronounced way.
The weaker trend in unit rents across Australia’s two largest cities is likely a reflection of their greater exposure to temporary overseas migrants as a source of rental tenancy, especially foreign students who would normally underpin inner-city high-rise rental demand.
The sharp drop in demand due to closed borders has been exacerbated by high supply levels as both cities come out of an unprecedented surge in inner-city apartment construction.
Although Melbourne and, to a lesser extent, Sydney unit rents remain soft, unit rents are starting to rise in these cities.
Sydney unit rents have consistently risen each month during 2021, while in Melbourne, unit rents have been rising since June.
The strongest rental markets remain in Perth and Darwin, however, the annual rate of rental growth in these cities appears to have peaked, while rental growth across the remaining capitals is continuing to trend higher.
With national housing values rising by 18.4% and rents rising by a lower 8.2%, the result is ongoing yield compression.
Nationally, gross rental yields have fallen to an all-time low of 3.32%.
It is no longer just Sydney and Melbourne where rental yields are plumbing historic lows.
Brisbane (3.99%), Hobart (4.01%), and Canberra (3.99%) have also seen gross rental yields fall to new record lows in August.
Australia’s housing market appears to be navigating the uncertainties associated with the Delta outbreaks much the same as we have seen through previous lockdowns.
Supported by low advertised stock levels relative to buyer demand, housing values are continuing to rise, albeit at a slower pace relative to earlier this year.
Inventory levels have fallen sharply across the cities where lockdowns persist, but more broadly, advertised stock levels remain low across the country as demand continues to outweigh supply resulting in a rapid rate of absorption of new listings.
The volume of home sales has trended lower, mostly due to restrictions in Sydney and Melbourne, where the number of sales is estimated to have fallen by -19% and -34% respectively when compared with the prior three-month period.
Rules associated with physical property inspections are stricter in Melbourne which probably helps to explain the larger reduction in sales activity.
With spring arriving, we would normally see new listing numbers starting to ramp up, and there is some evidence of this happening in Brisbane, Adelaide, Perth, and Hobart.
However, the same cannot be said for the cities where lockdown restrictions remain in place.
The trend in new listings remains weak in Sydney, Melbourne, and Canberra.
Housing market activity bounced back quite quickly following previous spot lockdowns and after Melbourne’s extended lockdown late last year, and we are expecting a similar turn of events once restrictions are eventually lifted.
There is likely to be an element of pent-up supply that is unleashed when restrictions ease which should see inventory levels rise.
Arguably there is greater uncertainty about whether demand will rise at the same level following lockdowns.
Affordability constraints are likely to progressively dampen housing market activity, and further down the track, there is the potential for credit tightening to also have a negative impact on demand.
A lift in advertised supply in the absence of more buyers could be another factor that weighs on price growth later this year.